
- Overview
- Genes
- Searching genes by identifier
- Displaying a summary of experimental data associated with selected genes
- Displaying gene expression distribution plots
- Performing single-gene survival analysis
- Displaying heatmap clustering of gene expression data for selected genes
- Performing multi-gene survival analysis
- Displaying a summary of correlation analysis with selected genes
- miRNAs
- Searching miRNAs by identifier
- Searching miRNA targets
- Displaying a summary of experimental data associated with selected miRNAs
- Displaying miRNA expression distribution plots
- Performing single-miRNA survival analysis
- Displaying heatmap clustering of miRNA expression data for selected miRNAs
- Performing multi-miRNA survival analysis
- Frequently Asked Questions
- Overview
Both the RNA-seq and miRNA-seq data for Low Grade Glioma (LGG) were downloaded from TCGA via GDC data portal and the PANCAN32 L4 RPPA (Reverse phase protein array) protein expression data from TCPA (The Cancer Proteome Atlas) portal. Data access and functionality are organized by data types: Genes, miRNAs.
- Genes
The Genes module gives access to gene-centric explorations of experimental data including protein expression data. This module is the default entry to the portal.

It has three main panels: the gene search panel, the participant panel, the experiment panel. The gene search panel presents options to search genes by identifiers, either gene symbol or gene entrez id. The experiment panel displays what kind of experimental data are presently available for visualization. For now these consist of gene expression and protein expression data. Gene expression data came from TCGA on illumina platforms and protein expression data from TCPA on RPPA platforms. Once options have been selected for each of the panels, pressing the "Search" button initiates a search and displays the search results.- Searching genes by identifier
The identifiers that can be used to search genes are "Symbol," which is the official HUGO symbol of the gene, or any known synonyms, "ID",
Lists of terms can be entered either manually in the text area, or uploaded from a text file. The terms in a list can be separated by any space character, commas, or semicolons.Gene ID: 1956, 4163 Symbol: EGFR, MCC
- Displaying a summary of experimental data associated with selected genes
Once the gene search term list has been entered, and the desired expression data options have been selected, pressing the "Search" button displays a summary of the experimental data from both gene and protein associated with the genes of interest. The following screen shows the results obtained from filling the search form as shown in Genes above.

First, the table shows a summary of the gene expression data followed by protein data in similar format, including: the gene ID, official symbol, the chosen platform, the number of samples arrayed, antibody for protein result and a quick overview of the expression distribution characteristics. For example, for gene EGFR, the mean of the distribution is 54.97, and the standard deviation is 123.00. To get an idea of how close to normal the distribution is, the means of the two tails (areas outside the IQR range of [-0.675sd,0.675sd]) and their size (the numbers of samples in the Down and Up range) are also displayed.
Second, the table contains links to external gene information from the NCBI Gene database, which can be useful for obtaining more information about the gene, as well as disambiguating in cases when you search by gene synonym and you do not recognize the search term in the displayed results.
Third, the table displays the visualization options available to you at this point. These are Displaying gene expression distribution plots and Performing single-gene survival analysis, both of which are accessed by pressing the image under the header "Plots" for the gene of interest. When the results indicate availability of data for two or more genes (as is the case in the example above), visualization options also include Displaying heatmap clustering of gene expression data for selected genes, which is accessed by pressing the heatmap image for the platform of choice under the table. Forth, the last column of the table gives option to show results of correlatuon analysis when click on the image under the header "Correlation Analysis" for the gene of interest. - Displaying gene expression distribution plots
The table for Displaying a summary of experimental data associated with selected genes contains a column called "Plots", which lists for each gene links for visualization of data associated with the gene and platform in question. Pressing the link associated with "EGFR" brings up a new window whose upper half displays the following graphs:


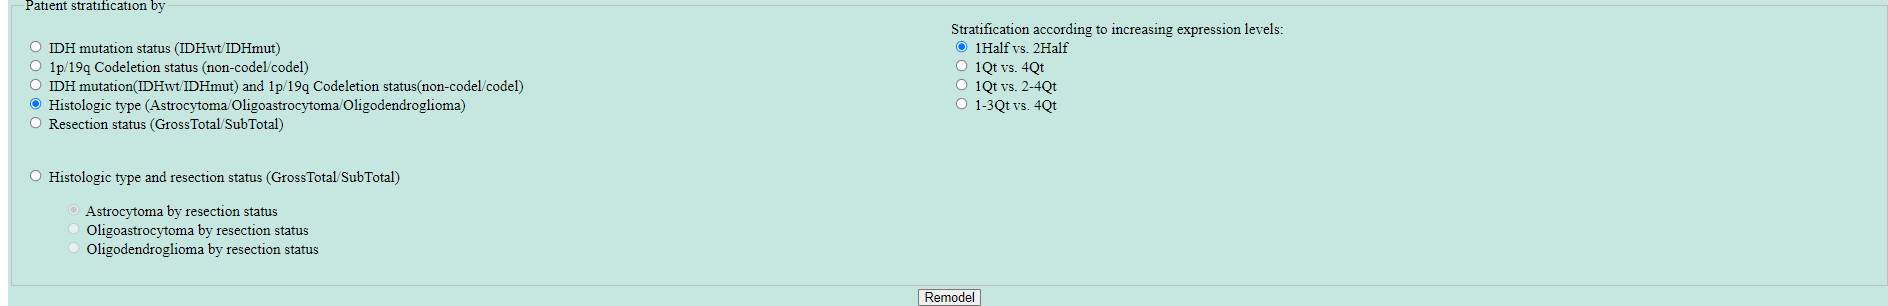
These graphs capture the distribution characteristics of the EGFR gene expressions over the available samples. The gene expressions have been z-scored for each sample over the entire gene panel. The table on the right show the p-values for differences in gene expressions calculated using a non-parametric Mann-Whitney test of the gene in question between the subtypes for the selected stratification. The differences in mean and 95% CI has been included for each subtypes. The numbered subtype mean can be associated with correct subtype by the order in stratification column.
The panel at the bottom displays options for stratification of samples. The default is stratification by IDH mutation status(IDHwt or IDHmut). However, other stratification as shown in the panel are available when selected. The patient stratification is based on the annotation reported by Verhaak et al., 2016. Furthermore, one may choose to stratify the samples according to increasing expression levels. There are four options available: "1Half vs. 2Half", "1Qt vs. 4Qt", "1Qt vs. 2-4Qt" and "1-3Qt vs. 4Qt". To rerun the analysis with new parameters, make the desired choices and press the "Remodel" button. See below the profile of EGFR after remodeling with different stratifications where samples are stratifed based on Histologic type (Astrocytoma/Oligoastrocytoma/Oligodendroglioma) and "1Qt vs. 4Qt" according to increasing expression levels:

- Performing single-gene survival analysis
The table for Displaying a summary of experimental data associated with selected genes contains a column called "Plots", which lists for each gene links for visualization of data associated with the gene in question. Pressing the link associated with "EGFR" brings up a new window whose lower half displays survival analysis graphs:

The row of graphs contains 3 plots: the first is a Kaplan-Meier survival curve comparison for samples classified according to their subtype. Note that this graph is not gene-specific. The next two plots show survival analysis for each subtype group (IDHwt or IDHmut). In each case the samples are further stratified according to gene expression levels. The default options display analysis for stratification of samples into two groups: those with (EGFR) expression levels smaller than the median over the subgroup, and those with higher than median expression levels. A p-value for the significance of difference between the two resulting curves is also displayed.
The survival analysis can be customized according to the options shown in the form. So first, one can choose to perform the Kaplan-Meier analysis by various stratefications avaiable on the page, Furthermore, one may choose to stratify the samples not just down the median of expressions, but say to compare samples with extreme expression of the gene of interest (for example, the lowest quartile, versus the highest quartile). To rerun the analysis with new parameters, make the desired choices and press the "Remodel" button. - Displaying heatmap clustering of gene expression data for selected genes
For gene searches that result in multiple hits, an option to display a heatmap -- clustering of the gene expressions according to their similarity, is made available. This is presented in the form of a heatmap icon following the table Displaying a summary of experimental data associated with selected genes. Clicking the icon in our example, displays the following screen.

The samples (columns of the heatmap) are annotated in three ways: first, according to cluster membership (the optimal number of clusters was determined using NbClust); second, according to subtype; and third, by inspecting the status of a prognostic index (which was computed by weight averaging the gene expressions with the regression coefficients of a multi-gene Cox proportional hazards model). The gene names are annotated with their respective Hazard Ratios in a multi-gene Cox proportional hazards model. The genes that were statistically significant (p <= 0.05) in that model are annotated with **, whereas the genes that are borderline significant (p <= 0.1) are annotated with *.
When search results involve more than 50 genes, we filter the genes by keeping the 50 genes whose expressions are most varied among the samples. - Performing multi-gene survival analysis
For gene searches that result in multiple hits, in addition to Displaying heatmap clustering we analyze how the expression profiles impact survival. We perform two types of survival analyses: first, we stratify the samples according to the heatmap cluster membership (see the first annotation bar), where the optimal number of clusters is picked out algorithmically. We use a Kaplan-Meier model to analyze the differences in survival.
We also stratify the samples according to subtypes as well as length of survival. The row of graphs contains 3 plots: the first is a Kaplan-Meier survival curve comparison for samples classified according to their subtype. Note that this graph is not gene-specific. The next two plots show survival analysis for each subtype group (IDHwt or IDHmut). In each case the samples are further stratified according to gene expression levels. The default options display analysis for stratification of samples into two groups: those with (EGFR) expression levels smaller than the median over the subgroup, and those with higher than median expression levels. A p-value for the significance of difference between the two resulting curves is also displayed.
The survival analysis can be customized according to the options shown in the form. So first, one can choose to perform the Kaplan-Meier analysis by various stratefications avaiable on the page, Furthermore, one may choose to stratify the samples not just down the median of expressions, but say to compare samples with extreme expression of the gene of interest (for example, the lowest quartile, versus the highest quartile). To rerun the analysis with new parameters, make the desired choices and press the "Remodel" button.
- Displaying a summary of correlation analysis with selected genes
The table for Displaying a summary of experimental data associated with selected genes contains a column called "Correlation Analysis", which lists for each gene links for a summary of genes correlated with the gene of interest. Pressing the link associated with "EGFR", the following screen shows the table with results obtained from correlation analysis:
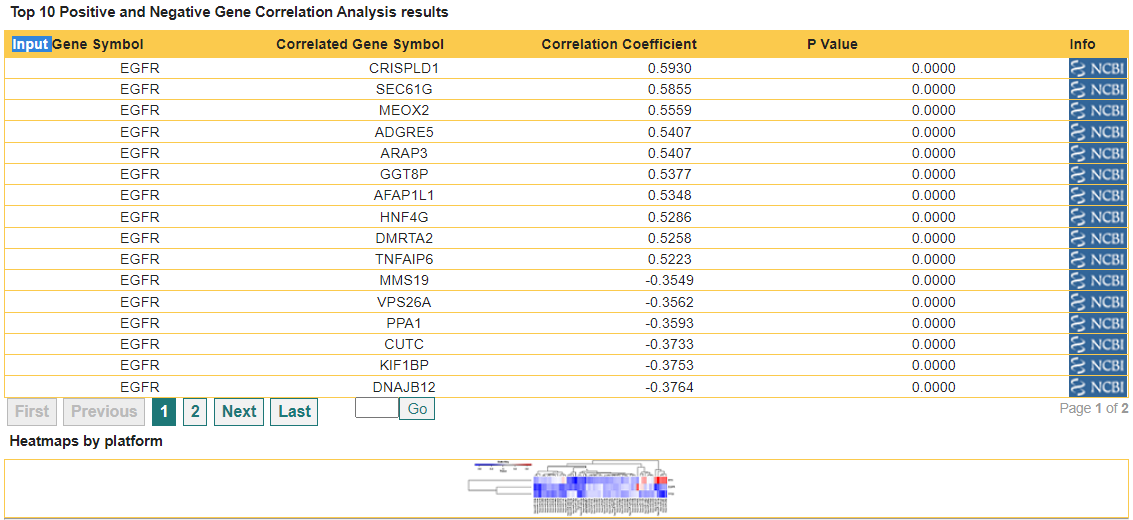
First, the table shows a summary of the gene correlation data, including: the input gene symbol, the correlated gene symbol, the correlation coefficeint and correlation P value
Second, the table contains links to external gene information from the NCBI Gene database, which can be useful for obtaining more information about the gene, as well as disambiguating in cases when you search by gene synonym and you do not recognize the search term in the displayed results.
Third, an option to display a heatmap of the correlation among correlated genes is made available. This is presented in the form of a heatmap icon. Clicking the icon in our example, displays the following screen as in Displaying heatmap clustering of gene expression data for selected genes
- Searching genes by identifier
- miRNAs
The miRNAs module gives access to miRNA-centric explorations of experimental and computational data. This module is accessed by selecting the "MIRNAS" tab of the interface.
It is analogous to the Genes module, and similarly has three main panels: the miRNA search panel, the participant panel, the experiments panel. The miRNA search panel presents options to search miRNAs by identifiers, either Symbol or Accession id. The experiments panel displays what kind of experimental data are presently available for visualization. For now these consists of miRNA expression data from one microarray study.
Once options have been selected for each of the panels -- by default there are options selected in all -- pressing the "Search" button initiates a search and displays the search results.- Searching miRNAs by identifier
The identifiers that can be used to search miRNAs are "Symbol," which is (part of) the official miRBase symbol of the miRNA, or other aliases; and "Accession," which is a unique identifier.
Lists of terms can be entered either manually in the text area, or uploaded from a text file. The terms in a list can be separated by any space character, commas, or semicolons.Symbol: hsa-let-7i, hsa-mir-6877 Accession: MI0000434, MI0022724
- Displaying a summary of experimental data associated with selected miRNAs
Once the miRNA search term list has been entered, pressing the "Search" button displays a summary of the experimental data associated with the miRNAs of interest. The following screen shows the results obtained from filling the search form as shown in miRNAs above.
This table shows analogous information to the one discussed in Displaying a summary of experimental data associated with selected genes. First, the table shows a summary of the miRNA expression data, including: the miRNA accession, official symbol, the number of samples arrayed, and a quick overview of the expression distribution characteristics. For example, for miRNA hsa-let-7i, the mean of the distribution is 352.48, and the standard deviation is 181.15. To get an idea of how close to normal the distribution is, the means of the two tails (areas outside the IQR range of [-0.675sd,0.675sd]) and their size (the numbers of samples in the Down and Up range) are also displayed.
Second, the table contains links to external miRNA information from the miRBase database, which can be useful for obtaining more information about the miRNA, as well as disambiguating in cases when you search by sequence.
Third, the table displays the visualization options available to you at this point. These are Displaying miRNA expression distribution plots and Performing single-miRNA survival analysis, both of which are accessed by pressing the image under the header "Plots" for the miRNA of interest. When the results indicate availability of data for two or more miRNAs (as is the case in the example above), visualization options also include Displaying heatmap clustering of miRNA expression data for selected miRNAs, which is accessed by pressing the heatmap image under the table. - Displaying miRNA expression distribution plots
Plots for displaying miRNA expression distribution are analogous to those for genes (described in detail in Displaying gene expression distribution plots). They can be accessed by selecting for the miRNA of interest the image under the header "Plots" in the table for Displaying a summary of experimental data associated with selected miRNAs.
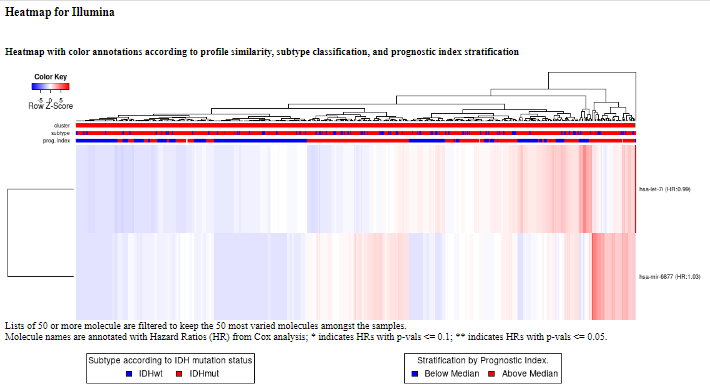
Pressing the link associated with "hsa-let-7i" brings up a new window whose upper half displays the following graphs:

These graphs capture the distribution characteristics of the miRNA expressions over the available samples. The expressions have been z-scored for each sample over the entire miRNa platform panel.
- Performing single-miRNA survival analysis
Survival analysis based on miRNA expression stratification is similar to that described for genes (see Performing single-gene survival analysis ). Here we show survival analysis for mir-34a, whose effect on GBM patient survival was studied by Genovese et al.

- Displaying heatmap clustering of miRNA expression data for selected miRNAs
This is analogous to Displaying heatmap clustering of gene expression data for selected genes. We simply show the heatmap resulting from our example (miRNAs).
- Performing multi-miRNA survival analysis
This is analogous to Performing multi-gene survival analysis . We first show the Kaplan-Meier plot for survival based on heatmap cluster membership.
Next are the plots for survival based on stratification according to sample subtypes as well as length of survival.

- Searching miRNAs by identifier
- Frequently Asked Questions
- Why is my gene/miRNA search producing no results?
There are several possibilities for why a gene search may produce no results.- First, make sure that you have selected the correct identifier type (Symbol, ID). Recall that the default selection is "Symbol."
- Second, your gene/miRNA of interest is not featured in any of the gene/miRNA expression dataset currently in the database.
- Who can I contact with technical questions or difficulties?
For any technical questions or difficulties, please contact us
- Why is my gene/miRNA search producing no results?