
- Overview
- Genes
- Searching genes by identifier
- Searching genes by description
- Selecting expression platforms
- Searching gene regulators
- Displaying a summary of experimental data associated with selected genes
- Displaying gene expression distribution plots
- Performing single-gene survival analysis
- Displaying heatmap clustering of gene expression data for selected genes
- Performing multi-gene survival analysis
- Displaying a summary of predicted gene regulators
- Displaying heatmap clustering of gene and miRNA expression data correlation
- miRNAs
- Searching miRNAs by identifier
- Searching miRNAs by sequence
- Selecting expression platforms
- Searching miRNA targets
- Displaying a summary of experimental data associated with selected miRNAs
- Displaying miRNA expression distribution plots
- Performing single-miRNA survival analysis
- Displaying heatmap clustering of miRNA expression data for selected miRNAs
- Performing multi-miRNA survival analysis
- Displaying a summary of experimental data associated with predicted miRNA targets
- Displaying heatmap clustering of miRNA and gene expression data correlation
- Experiments
- Models
- Frequently Asked Questions
- Overview
In addition to data from the TCGA, The GBM dataset also incorporates knowledge from computational analyses (such as the four molecular subtypes identified by Verhaak et al., 2010) and predictions (such as predicted microRNA targets), in order to enable intuitive access to the accumulated knowledge on GBM.
Data access and functionality are organized around several modules: Genes, miRNAs, Experiments, and Models.
- Genes
The Genes module gives access to gene-centric explorations of experimental and computational data. This module is the default entry to the portal.

It has four main panels: the gene search panel, the participant panel, the experiments panel, and the regulator panel. The gene search panel presents options to search genes by identifiers, or description, and a search term input area. The participants panel gives the option to restrict data search to samples that were studied by Verhaak et al., 2010 in their GBM classification study (Verhaak Core), to include samples that have been computationally classified into one of the Verhaak et al.'s subtypes (Extended Verhaak), or to consider the entire set of samples. The experiments panel displays what kind of experimental data are presently available for visualization. For now these consist of gene expression and protein expression data. Gene expression data has been generated from experiments on three different platforms, as well as from aggregating the data from the three platforms. The aggregates come in two sets: a complete one with expression data for every gene that is featured in all three platforms (Aggregates), and a filtered set (Verhaak Core) which contains 840 genes that were stipulated by Verhaak et al., 2010 to have special significance for characterizing the molecular subtypes of GBM. The regulators panel gives the option to search for experimental data associated with miRNAs predicted to target the genes of interest.
Once options have been selected for each of the panels -- by default there are options selected in all but the regulators panel -- pressing the "Search" button initiates a search and displays the search results.- Searching genes by identifier
The identifiers that can be used to search genes are "Symbol," which is the official HUGO symbol of the gene, or any known synonyms, "ID", or a "Locus tag."
Lists of terms can be entered either manually in the text area, or uploaded from a text file. The terms in a list can be separated by any space character, commas, or semicolons.Gene ID: 25, 135 Symbol: ABL1, AATK Locus tag: RP1-179N16.4, RP11-83J21.1
- Searching genes by description
A more general way of searching for genes is by terms that appear in their description.
Lists of terms can be entered either manually in the text area, or uploaded from a text file. The terms in a list can be separated by any space character, commas, or semicolons.Description: tyrosine, receptor
- Selecting expression platforms
The expression platform options appear in the experiment panel. Currently they consist of gene expression data from three microarray platforms (Affymetrix, Agilent, and Exon arrays), one data set generated by aggregating the three platform data following Verhaak et al., 2010 (Aggregates), and a filtered set of aggregates containing 840 genes (Verhaak 840 Core); Protein expression (Reversed Phase Protein Array) are also available for a subset of the samples.
The default selection is "Verhaak 840 Core." - Searching gene regulators
The regulators panel currently displays an option to search gene regulators -- miRNAs computationally predicted by MicroCosm V5 to target the genes of interest. This option is not selected by default, and will have to be selected explicitly. - Displaying a summary of experimental data associated with selected genes
Once the gene search term list has been entered, and the desired gene expression options have been selected, pressing the "Search" button displays a summary of the experimental data associated with the genes of interest. The following screen shows the results obtained from filling the search form as shown in Genes above.
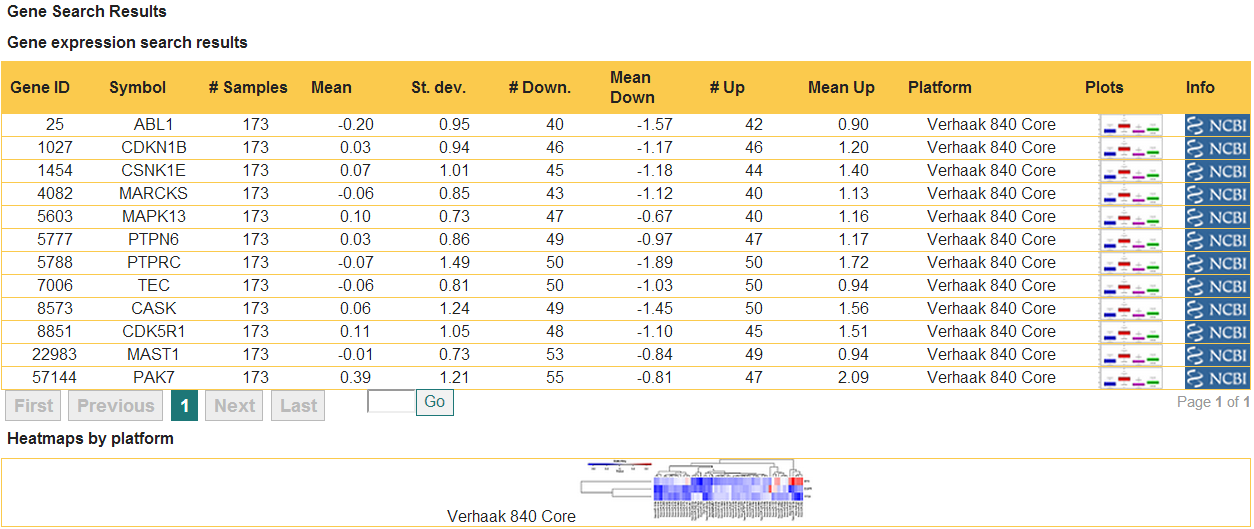
First, the table shows a summary of the gene expression data, including: the gene ID, official symbol, the chosen platform, the number of samples arrayed, and a quick overview of the expression distribution characteristics. For example, for gene ABL1, the mean of the distribution is -0.20, and the standard deviation is 0.95. To get an idea of how close to normal the distribution is, the means of the two tails (areas outside the IQR range of [-0.675sd,0.675sd]) and their size (the numbers of samples in the Down and Up range) are also displayed.
Second, the table contains links to external gene information from the NCBI Gene database, which can be useful for obtaining more information about the gene, as well as disambiguating in cases when you search by description, or gene synonym and you do not recognize the search term in the displayed results.
Third, the table displays the visualization options available to you at this point. These are Displaying gene expression distribution plots and Performing single-gene survival analysis, both of which are accessed by pressing the image under the header "Plots" for the gene of interest. When the results indicate availability of data for two or more genes (as is the case in the example above), visualization options also include Displaying heatmap clustering of gene expression data for selected genes, which is accessed by pressing the heatmap image for the platform of choice under the table. - Displaying gene expression distribution plots
The table for Displaying a summary of experimental data associated with selected genes contains a column called "Plots", which lists for each gene links for visualization of data associated with the gene and platform in question. Pressing the link associated with "ABL1" brings up a new window whose upper half displays the following graphs:
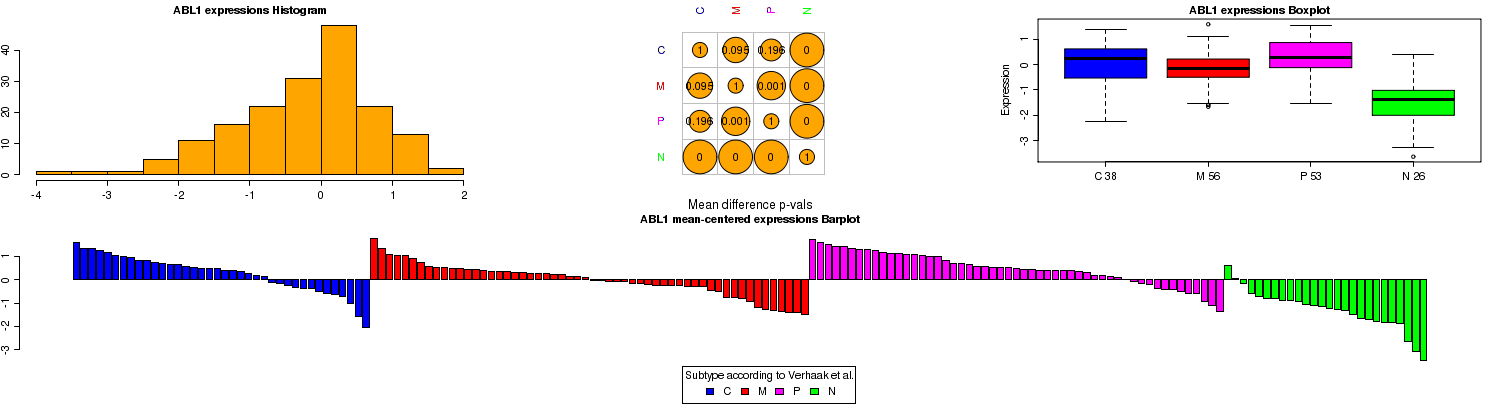

These graphs capture the distribution characteristics of the ABL1 gene expressions over the available samples. The gene expressions have been z-scored for each sample over the entire gene platform panel. The histogram for ABL1 shows that its gene expression is close to being normally distributed with a slightly longer lower expression tail. Compared to the other genes in the panel, ABL1 overall does not show increased or decreased expression (its mean of distribution is close to 0).
The boxplot on the right hand side shows distribution of ABL1 expression according to molecular subtype of each sample: classical (C), mesenchymal (M), proneural (P), neural (N) as characterized by Verhaak et al., 2010. In cases when the user queries expressions of all participants, not just those characterized in this paper, an additional fifth category will appear labeled as "U" for unknown subtype. ABL1 appears to be underexpressed in the neural subtype.
The middle plot tabulates the difference between the subgroups, pairwise. It displays the p-values of running t-tests on each subgroup pair. In our example, it shows that the expression of ABL1 in the neural samples is significantly different from any of the other subtypes (p-value is 0).
Lastly, the barplot is yet another representation of the distribution of the gene expression. Here each bar represents the z-score of a sample, mean-centered over all samples. Therefore, it displays the relative expression of the gene in the different sample subtypes.
The panel immediately below the barplots displays options for stratification of samples. The default is stratification by molecular subtype, which we discussed. However, it is possible to instead stratify the samples according to length of survival, with the intent of characterizing the profiles of long versus short survivors. See below the profile of ABL1 when samples are stratified according to the length of survival.

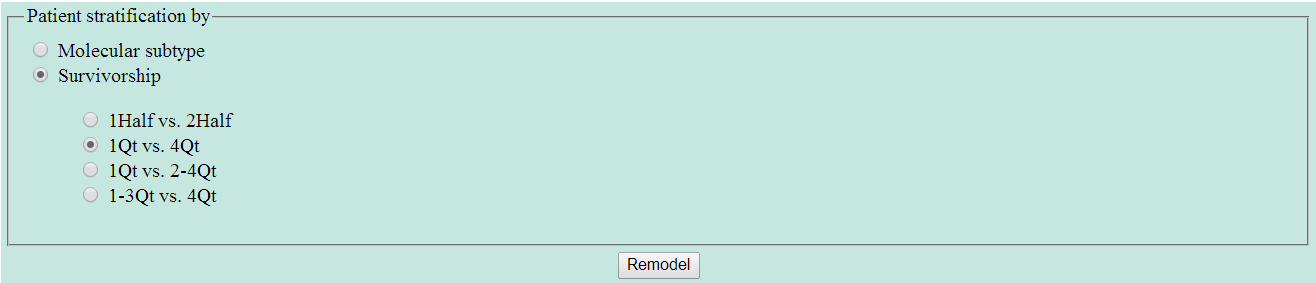
We have selected here the option to compare patients with shortest survival (first quadrant, survival 8-225 days) to patients with longest survival (forth quadrant, survival 630-3524 days). The boxplot shows that longer surviving patients have higher expressions of ABL1. Indeed, the t-test panel shows that the difference in the level of expression of ABL1 are significant (p-value is 0.026). - Performing single-gene survival analysis
The table for Displaying a summary of experimental data associated with selected genes contains a column called "Plots", which lists for each gene links for visualization of data associated with the gene and platform in question. Pressing the link associated with "ABL1" brings up a new window whose lower half displays survival analysis graphs:


The row of graphs contains 5 plots: the first is a Kaplan-Meier survival curve comparison for samples classified according to their subtype. Note that this graph is not gene-specific. The next four plots show survival analysis for each sample group (classical, mesenchymal, proneural, and neural). In each case the samples are further stratified according to gene expression levels. The default options display analysis for stratification of samples into two groups: those with (ABL1) expression levels smaller than the median over the subgroup, and those with higher than median expression levels. A p-value for the significance of difference between the two resulting curves is also displayed. For example, the proneural samples show significant difference in survival if split into the group with low expression of ABL1, and high expression of ABL1 (p-value 0.0021). The group with high expression of ABL1 (red line) show better survival.
The survival analysis can be customized according to the options shown in the form. So first, one can choose to perform the default Kaplan-Meier analysis, or do a Cox-proportional hazards analysis, where factors such as the age of the patients, and the methylation status of MGMT (a studied and known factor in survival of GBM patients) can also be taken into consideration. Furthermore, one may choose to stratify the samples not just down the median of expressions, but say to compare samples with extreme expression of the gene of interest (for example, the lowest quartile, versus the highest quartile). To rerun the analysis with new parameters, make the desired choices and press the "Remodel" button. - Displaying heatmap clustering of gene expression data for selected genes
For gene searches that result in multiple hits, an option to display a heatmap -- clustering of the gene expressions according to their similarity, is made available. This is presented in the form of a heatmap icon following the table Displaying a summary of experimental data associated with selected genes. Clicking the icon in our example, displays the following screen.


The samples (columns of the heatmap) are annotated in three ways: first, according to cluster membership (the optimal number of clusters was determined using NbClust); second, according to Verhaak et al. subtype; and third, by inspecting the status of a prognostic index (which was computed by weight averaging the gene expressions with the regression coefficients of a multi-gene Cox proportional hazards model). The gene names are annotated with their respective Hazard Ratios in a multi-gene Cox proportional hazards model. The genes that were statistically significant (p <= 0.05) in that model are annotated with **, whereas the genes that are borderline significant (p <= 0.1) are annotated with *.
When search results involve more than 50 genes, we filter the genes by keeping the 50 genes whose expressions are most varied among the samples. - Performing multi-gene survival analysis
For gene searches that result in multiple hits, in addition to Displaying heatmap clustering we analyze how the expression profiles impact survival. We perform two types of survival analyses: first, we stratify the samples according to the heatmap cluster membership (see the first annotation bar), where the optimal number of clusters is picked out algorithmically. We use a Kaplan-Meier model to analyze the differences in survival.
We also analyze the effect of the gene expressions on survival by constructing a multi-gene prognostic index as follows. A Cox proportional hazards model is constructed with each gene as a covariate. A prognostic index is computed for each sample by weight averaging each gene's expression by its regression coefficient in the Cox model. Samples are then stratified by prognostic index (the default option is stratification down the median). The prognostic index status (which is depicted in the third annotation bar in the heatmap), in addition with optional covariates of Age, and MGMT methylation status are used to construct a Cox model, as seen below. We construct a model for the full cohort of samples, as well as for samples stratified according to their GBM subtype. In some situations the Cox-model cannot be computed (the model is non-convergent); when this happens the plots are not informative.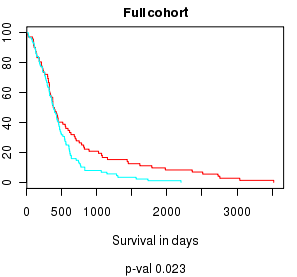


- Displaying a summary of predicted gene regulators
Once the gene search term list has been entered, and the option to display gene regulators has been selected (as described in Searching gene regulators) pressing the "Search" button displays, in addition to the table Displaying a summary of experimental data associated with selected genes, a table that looks as follows:
First, the table shows a list of miRNAs that are computationally predicted by sequence analysis to target the genes of interest. The predictions are downloaded from MicroCosm V5. Typically, each gene is predicted to be targeted by multiple miRNAs, and therefore there are multiple lines of miRNAs associated with each gene ID. In addition to the miRNA identifiers (such as name, accession), the mature miRNA sequence is also displayed. So is the strength of the computational prediction (p-value). To limit the number of miRNAs displayed per gene, we use a cutoff p-value of <= 0.05.
Second, the table contains links to external miRNA information from the miRBase database, which can be useful for obtaining more information about the miRNA
Third, the table displays the visualization options associated with gene regulators. These are Displaying miRNA expression distribution plots and Performing single-miRNA survival analysis, both of which are accessed by pressing the image under the header "Plots" for the miRNA of interest. When the results indicate availability of data for two or more genes and two or more miRNAs (as is the case in the example above), visualization options also include Displaying heatmap clustering of gene and miRNA expression data correlation, which is accessed by pressing the heatmap image under the table. - Displaying heatmap clustering of gene and miRNA expression data correlation
For searches that result in multiple hits of genes and miRNAs, an option to display a heatmap of the correlation between the gene and miRNA expressions is made available. This is presented in the form of a heatmap icon following the table Displaying a summary of predicted gene regulators. Clicking the icon in our example, displays the following screen.
Each cell of the heatmap represents how the expressions of the gene in that row, and the miRNA in that column are correlated, and is annotated with the correlation value. A strong negative correlation may indicate that the gene is a direct target of the miRNA in question, or more generally a sponge-like interaction. In other words, higher levels of expression of the miRNA in question is associated with lower levels of expression of the gene in question. Combined with the fact that the miRNAs considered are predicted by sequence analysis to target the genes in question, strong negative correlations can, therefore, strengthen a hypothesis of direct interactions.
A strong positive correlation may, instead, point to so-called non-sponge interactions, where the regulatory effect of miRNAs might be achieved through indirect mechanisms, such as targeting regulatory networks of the genes in question.
- Searching genes by identifier
- miRNAs
The miRNAs module gives access to miRNA-centric explorations of experimental and computational data. This module is accessed by selecting the "MIRNAS" tab of the interface.
It is analogous to the Genes module, and similarly has four main panels: the miRNA search panel, the participant panel, the experiments panel, and the target panel. The miRNA search panel presents options to search miRNAs by identifiers, or sequence, and a search term input area. The participants panel gives the option to restrict data search to samples that were studied by Verhaak et al., 2010 in their GBM classification study (Verhaak Core), an extended sample including computationally classified samples (Extended Verhaak), or all available samples (All). The experiments panel displays what kind of experimental data are presently available for visualization. For now these consists of miRNA expression data from one microarray study. The targets panel gives the option to search for experimental data associated with gene targets of the miRNAs of interest.
Once options have been selected for each of the panels -- by default there are options selected in all but the targets panel -- pressing the "Search" button initiates a search and displays the search results.- Searching miRNAs by identifier
The identifiers that can be used to search miRNAs are "Symbol," which is (part of) the official miRBase symbol of the miRNA, or other aliases; and "Accession," which is a unique identifier.
Lists of terms can be entered either manually in the text area, or uploaded from a text file. The terms in a list can be separated by any space character, commas, or semicolons.Symbol: hsa-let-7, miR-32 Accession: MIMAT0000414, MIMAT0000415
- Searching miRNAs by sequence
miRNAs can also be searched by nucleotide sequence. To do this select the "Sequence" option in miRNAs search panel.Sequence: aguagguuguauaguu, acuaaguugc - Selecting expression platforms
For the moment there is only one miRNA expression study, and this is the default selection. - Searching miRNA targets
The targets panel currently displays an option to search miRNA targets -- genes computationally predicted by MicroCosm V5 to be targeted by the miRNAs of interest. This option is not selected by default, and will have to be selected explicitly. - Displaying a summary of experimental data associated with selected miRNAs
Once the miRNA search term list has been entered, pressing the "Search" button displays a summary of the experimental data associated with the miRNAs of interest. The following screen shows the results obtained from filling the search form as shown in miRNAs above.
This table shows analogous information to the one discussed in Displaying a summary of experimental data associated with selected genes. First, the table shows a summary of the miRNa expression data, including: the miRNA accession, official symbol, the number of samples arrayed, and a quick overview of the expression distribution characteristics. For example, for miRNA hsa-let-7b, the mean of the distribution is 13.97, and the standard deviation is 0.49. To get an idea of how close to normal the distribution is, the means of the two tails (areas outside the IQR range of [-0.675sd,0.675sd]) and their size (the numbers of samples in the Down and Up range) are also displayed.
Second, the table contains links to external miRNA information from the miRBase database, which can be useful for obtaining more information about the miRNA, as well as disambiguating in cases when you search by sequence.
Third, the table displays the visualization options available to you at this point. These are Displaying miRNA expression distribution plots and Performing single-miRNA survival analysis, both of which are accessed by pressing the image under the header "Plots" for the miRNA of interest. When the results indicate availability of data for two or more miRNAs (as is the case in the example above), visualization options also include Displaying heatmap clustering of miRNA expression data for selected miRNAs, which is accessed by pressing the heatmap image under the table. - Displaying miRNA expression distribution plots
Plots for displaying miRNA expression distribution are analogous to those for genes (described in detail in Displaying gene expression distribution plots). They can be accessed by selecting for the miRNA of interest the image under the header "Plots" in the table for Displaying a summary of experimental data associated with selected miRNAs.
We show the plots for "mir-34a" which was recently identified by Genovese et al. as a regulator of TGF-Beta in GBM.

These graphs capture the distribution characteristics of the miRNA expressions over the available samples. The expressions have been z-scored for each sample over the entire miRNa platform panel.
Genovese et al. show that mir-34a expression levels are lower in patients with proneural profile of GBM. This is clearly visible in the boxplot, and barplot. - Performing single-miRNA survival analysis
Survival analysis based on miRNA expression stratification is similar to that described for genes (see Performing single-gene survival analysis ). Here we show survival analysis for mir-34a, whose effect on GBM patient survival was studied by Genovese et al.


Similarly to Genovese et al. we see that for patients with proneural profiles, lower expression of mir-34a are associated with improved survival rates. Proneural patients with below median expression of mir-34a (blue line on survival graphs) live longer compared to the other patients. This effect is statistically significant even when we remove the effect of age on the analysis. For this we perform a Cox proportial-hazards regression with expression of mir-34a and age as covariates. Both covariates have significant p-values (<0.05), and the expression levels of mir-34a show a larger hazard ratio (3.088) than age (1.021). These results are similar to those shown by Genovese et al. By comparison, none of the other subtypes show expression levels of mir-34a to be prognostic of survival (all the p-values for expression of mir-34a are > 0.05).
- Displaying heatmap clustering of miRNA expression data for selected miRNAs
This is analogous to Displaying heatmap clustering of gene expression data for selected genes. We simply show the heatmap resulting from our example (miRNAs).

- Performing multi-miRNA survival analysis
This is analogous to Performing multi-gene survival analysis . We first show the Kaplan-Meier plot for survival based on heatmap cluster membership.
Next are the plots for Cox proportional hazards analysis based on the computed multi-miRNA prognostic index.


- Displaying a summary of experimental data associated with predicted miRNA targets
Once the miRNA search term list has been entered, and the option to display gene targets has been selected (as described in Searching miRNA targets) pressing the "Search" button displays, in addition to the table Displaying a summary of experimental data associated with selected miRNAs, two tables that look as follows:
Each table shows a list of genes/proteins that are computationally predicted by sequence analysis to be targets of the miRNAs of interest. The predictions are downloaded from MicroCosm V5. Typically, each miRNA is predicted to targeted multiple genes, and therefore there are multiple lines of genes associated with each miRNA accession. In addition to the gene identifiers, the strength of the computational prediction (p-value). To limit the number of genes displayed we use a cutoff p-value of <= 0.05.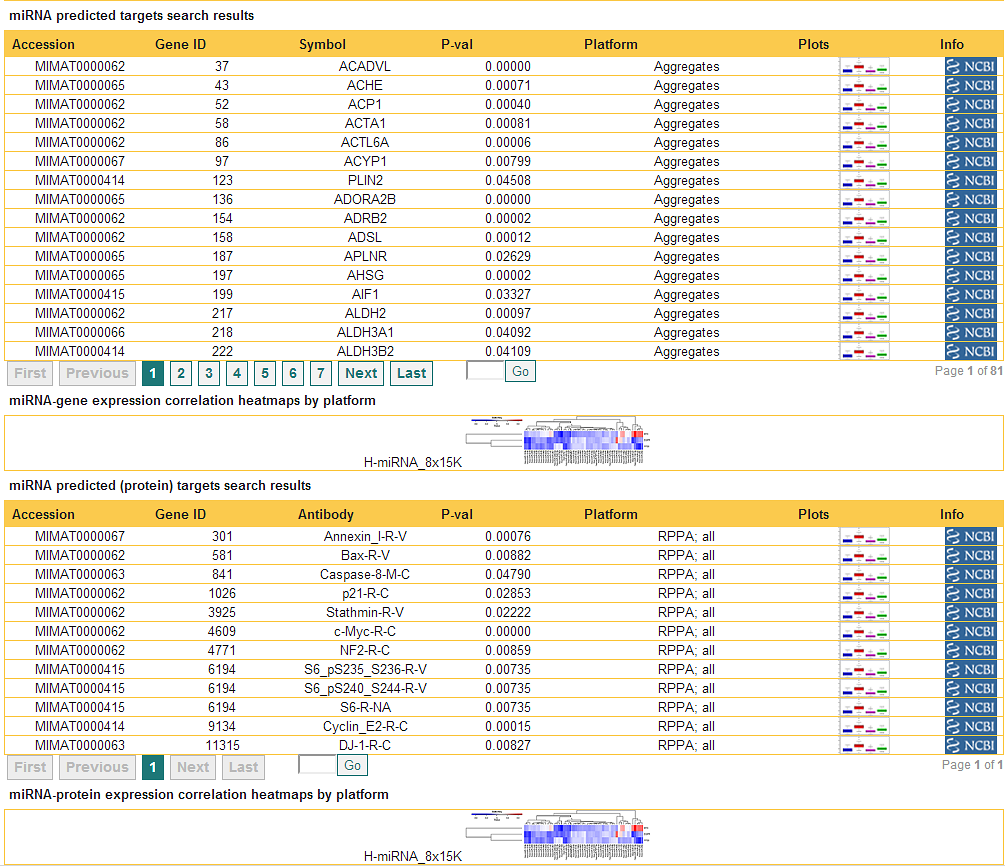
Second, each table displays links to external gene information from the NCBI Gene database. Third, the table displays the visualization options associated with the shown gene/protein expressions. These are Displaying gene expression distribution plots and Performing survival analysis based on gene expression stratification, both of which are accessed by pressing the image under the header "Plots" for the gene of interest. When the results indicate availability of data for two or more genes and two or more miRNAs, visualization options also include Displaying heatmap clustering of miRNA and gene expression data correlation, which is accessed by pressing the heatmap image under the table. - Displaying heatmap clustering of miRNA and gene expression data correlation
This is covered in detail in Displaying heatmap clustering of gene and miRNA expression data correlation.
- Searching miRNAs by identifier
- Experiments
The experiments tab presents a summary of the data populating the database. Recall that all the data are part of the TCGA.
For each study or experiment we display the center, platform, number of samples or patients studied, and number of features (genes/miRNAs/etc) profiled. The "Level" indicates how much pre-processing the data have undergone. The levels are designated by the TCGA. Typically, level 3 indicates normalization of data and aggregation at the feature level.
- Models
The models tab enables analysis of user-uploaded expression data, and their classification into GBM subtypes. The mRNA model is trained using the Verhaak et al. classification of 201 samples, and the corresponding gene expressions for genes common in Verhaak 840 panel and user entered data. The miRNA model is trained using the miRNA expression data.There are options to select whether the user expression data is mRNA or miRNA, and the classification method of choice.
- Uploading cell line data
The cell line data should be uploaded as a text file formated as shown in this example. Where the row names are gene (or miRNA) symbols and the column
names are samples. There is currently a limit (10Mb) on the size of the file.

- Picking a prediction model The two prediction models available are PAM and Random Forest.
- Displaying prediction results
The model is constructed using the data for the common features from the training data and
the user provided cell line data. Prediction results are displayed in the following form.
There are 5 panels. The top left panel shows the accuracy of the clustering method on the training data. The top right panel shows the prediction results, with each cell line being assigned a GBM subgroup, and with the probabilities with which the model associates the cell line to the assigned group. The bottom panels from left to right show the profiles of the most important features from the classification point of view, the power of prediction of these features, and a correlation heatmap between training and cell line data.

- Showing an example Press the "Show example" button to see an example analysis.
- Uploading cell line data
The cell line data should be uploaded as a text file formated as shown in this example. Where the row names are gene (or miRNA) symbols and the column
names are samples. There is currently a limit (10Mb) on the size of the file.
- Frequently Asked Questions
- Why is my gene search producing no results?
There are several possibilities for why a gene search may produce no results.- First, make sure that you have selected the correct identifier type (Symbol, ID, etc.). Recall that the default selection is "Symbol."
- Second, if you have selected all the expression platforms, but still see no matches, that means that your gene of interest is not featured in any of the gene expression studies currently in the database.
- Why is my search for gene regulators producing no results?
There are several possibilities for why a search for gene regulators may produce no results.- First, make sure that the "MicroCosm V5" checkbox on the regulators panel is selected.
- Second, only miRNAs with significant prediction scores (P-val <= 0.05) are included in the results. Your gene of interest might not be associated with any miRNAs in a significant way.
- Third, the miRNA expression platform features 534 miRNAs, so any predicted regulators that are not in the 534 list will not appear in the results, regardless of the strength of their prediction.
- Who can I contact with technical questions or difficulties?
For any technical questions or difficulties please contact us.
- Why is my gene search producing no results?